
The average Vale home added £22,370 in a year to July, the 28th fastest rise of 295 English districts, while Oxford and West Oxfordshire both fell.
The average home in the Vale of White Horse sold for £413,773 in July 2026. That is £22,370 more than a year earlier, a rise of 5.7%.
It is still the fastest annual rise of Oxfordshire’s five districts. Across England it ranks 28th of 295 local authority districts.
The figures come from HM Land Registry’s UK House Price Index for July, published on 16 September. The index is built from completed sales, so it runs a couple of months behind the market but records what buyers actually paid.
Still top of the county
The same five districts led and trailed as in June. Two lost value over the year, and one of them is the city next door.
| District | Average, July 2026 | Annual change |
|---|---|---|
| Vale of White Horse | £413,773 | +5.7% |
| Cherwell | £356,935 | +4.7% |
| South Oxfordshire | £476,026 | +3.0% |
| West Oxfordshire | £418,586 | -1.6% |
| Oxford | £471,667 | -2.3% |
Oxfordshire as a whole rose 2.4%, to £420,093. The South East rose just 0.2% and England 1.1%.
Nationally, 27 districts rose faster than the Vale and 85 of the 295 fell. Those rankings come from the Land Registry’s full data file, which carries every area in one table.
A small dip on the month
The annual figure hides a slight fall between June and July. The Vale average slipped 0.3%, or £1,321, from a revised June figure of £415,094.
That is not unusual. The Vale’s average has fallen in three of the last seven months, February, April and July, while the annual change stayed positive throughout.
The highest monthly average in the series is £415,880, in January 2026. July is £2,107 below it.
Family homes are still doing the work
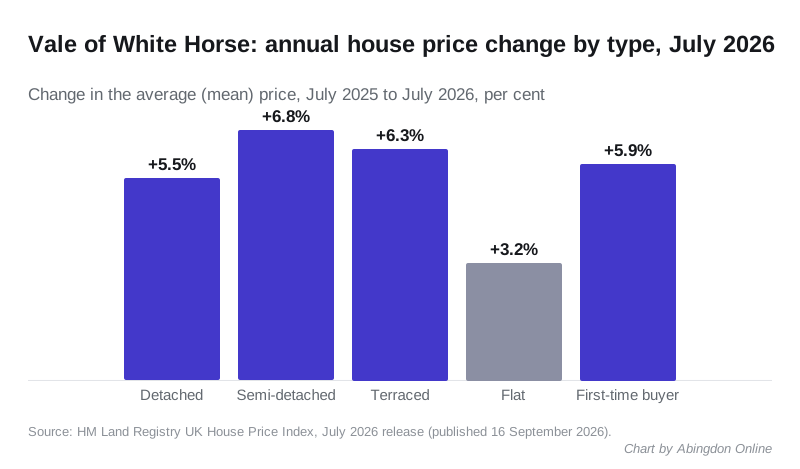
| Type | Average, July 2026 | Annual change |
|---|---|---|
| Detached | £670,190 | +5.5% |
| Semi-detached | £404,031 | +6.8% |
| Terraced | £326,211 | +6.3% |
| Flat | £208,002 | +3.2% |
Semi-detached and terraced homes rose fastest, as they did in June. Flats rose slowest.
One detail stands out. The average Vale flat, at £208,002, is now cheaper than the average flat in England as a whole, which is £217,362. Every type of house in the Vale sits well above its national equivalent: the average English semi-detached home is £292,024.
The average price paid by a first-time buyer in the district was £331,515, up 5.9%. That is £18,403 more than in July 2025.
June has been revised up
Our June report gave the Vale average as £414,441, up 6.3%. In this month’s file June now reads £415,094, up 6.5%.
That is how the index works. Late-registered sales feed into earlier months, so each figure moves for several releases. January 2026 was £418,630 in last month’s file and is £415,880 in this one.
Sales counts are not a clean read yet
The latest month with a sales count is May 2026, when the Land Registry recorded 111 sales in the Vale. May 2025 had 173.
Do not read that as a 36% slump. Recent counts rise as late registrations arrive: March 2026 was 114 sales in last month’s file and is 129 now. Spring 2025 was also distorted by the stamp duty change on 1 April 2025, with 377 Vale sales in March 2025 and just 81 in April.
Two things to hold in mind
This is a mean, not a median. The index averages every sale, so a few expensive completions lift it. A median would sit lower.
One district, several markets. The figure covers Abingdon, Wantage, Grove, Faringdon, Botley and the villages. Our Abingdon house prices page sets it against sold prices in the town itself, which is closer to what a particular street is worth.
What it means for you
If you are selling, the Vale is still the strongest of the five Oxfordshire districts over a year. Semi-detached and terraced sellers are in the busiest part of the market. The July dip is too small to call a turn.
If you are buying a first home, the first-time buyer average rose £18,403 in a year. Flats rose slowest, at 3.2%, and are the one type now cheaper here than the national average.
If you are watching supply, the district’s planning decisions are the long-run lever. Prices move with how many homes get built, not with one month’s sales.
Sources
- HM Land Registry UK House Price Index, Vale of White Horse, July 2026 for the district’s average price, annual and monthly change, type splits and first-time buyer average.
- UK House Price Index full data file, July 2026 for the Oxfordshire, South East and England comparisons, the ranking against all 295 English local authority districts, the monthly series and the sales counts.
- UK House Price Index full data file, June 2026 for the figures as first published, used for the revisions.
- UK House Price Index reports for the release schedule and methodology.
Have your say